The question
One province against a group
How does a province compare with a set of other provinces on several indicators at the same time?
This was the first task of the course project. The hard part is that the comparison has two levels: the province against the group as a whole, and the province against each single member of the group. A chart that shows only the average hides the spread; a chart that shows every province at once becomes a tangle of lines.
The indicators also don't agree on what "high" means. More employment is good, more PM2.5 is not, and they are measured in years, euros, percentages and µg/m³.
Provinces
107
Indicators
67
"Lower is better"
29
Rough sketches
23
Data
ISTAT, BES dei territori 2025
BES (Benessere equo e sostenibile) is ISTAT's set of well-being indicators beyond GDP: health, education, work, income, safety, environment, services. The provincial edition comes as a long Excel file, one row per indicator, territory and sex, one column per year from 2004 to 2024.
- One row per province Totals only, no split by sex. A Python script turns the ISTAT file into a 107 × 67 table.
- One year per indicator The most recent year in which at least 100 of the 107 provinces have a value. The year is shown under every indicator in the chart.
- Missing stays missing No zeros, no imputation. A missing value is written as N.A., and the group mean uses only the provinces that have one.
- A polarity for each indicator +1 if higher is better, −1 if lower is better, following the direction ISTAT uses in its reports. The values are never flipped: polarity only decides the colour.
- Redundancy checked Only 21 of the 2,211 pairs of indicators have |r| ≥ 0.85, so the set is not just the same thing measured many times.
Sketches
23 drawings, three candidates
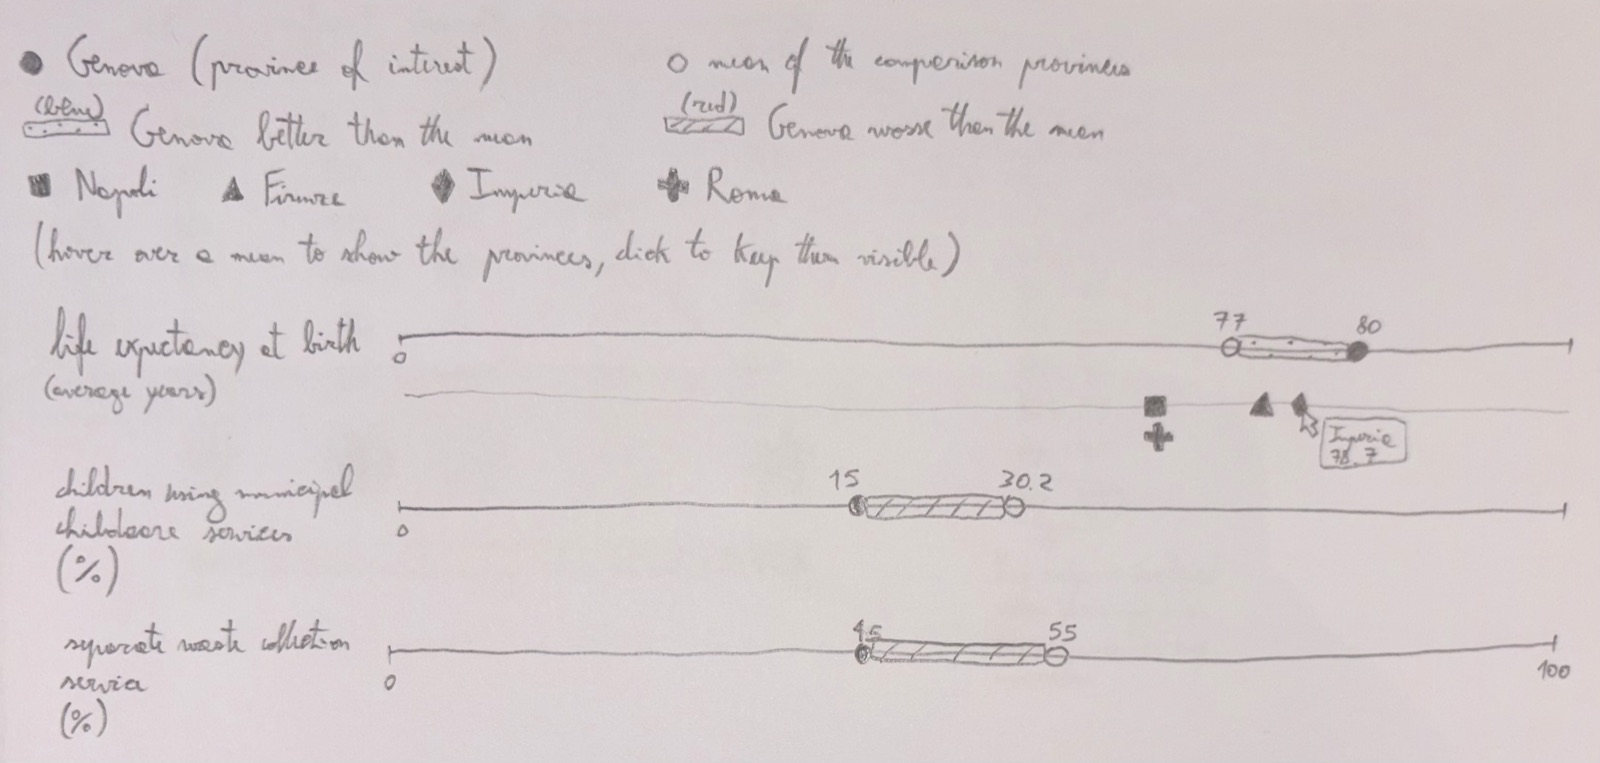
Before any code, Andrea and I drew 23 rough sketches on paper: radar charts, heatmaps, rank charts, parallel coordinates, small multiples. We developed three of them in detail.
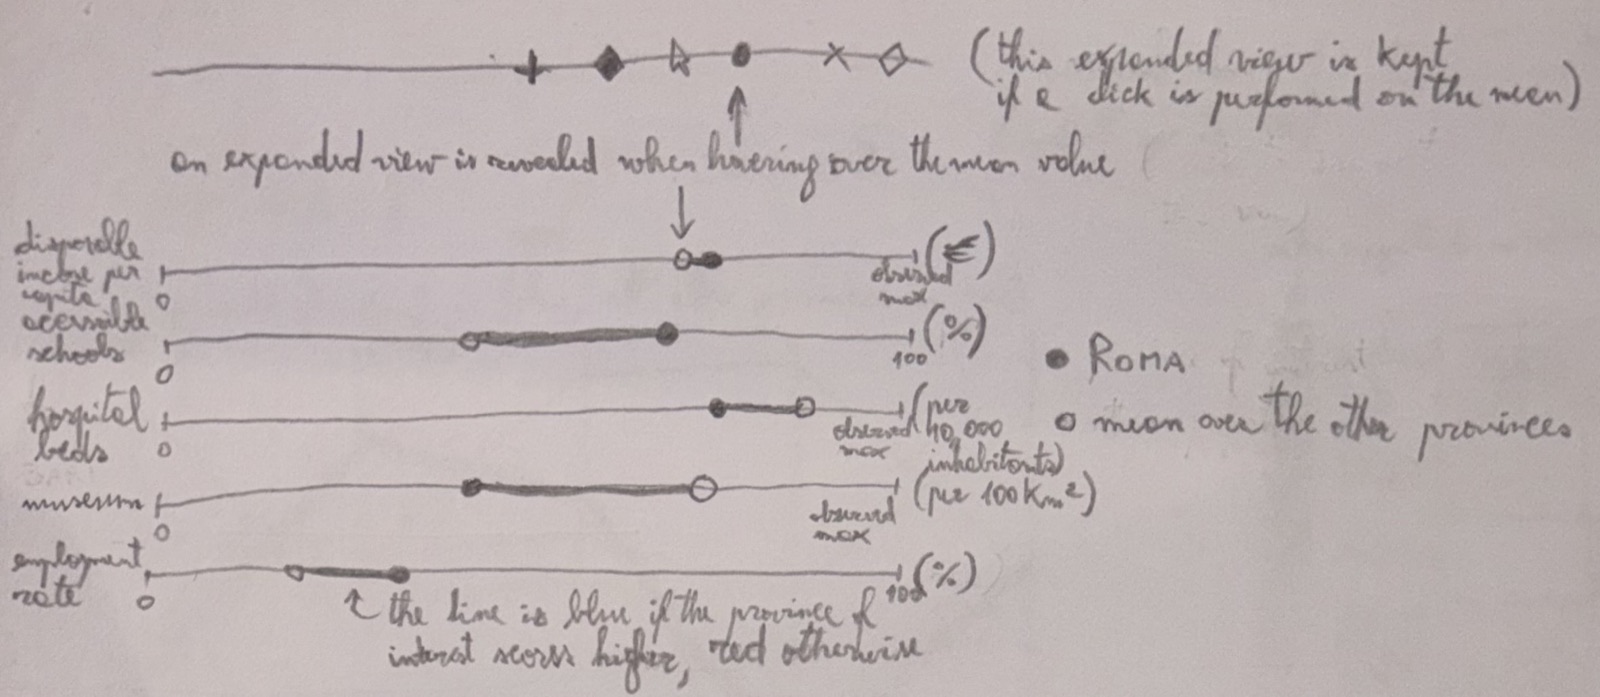
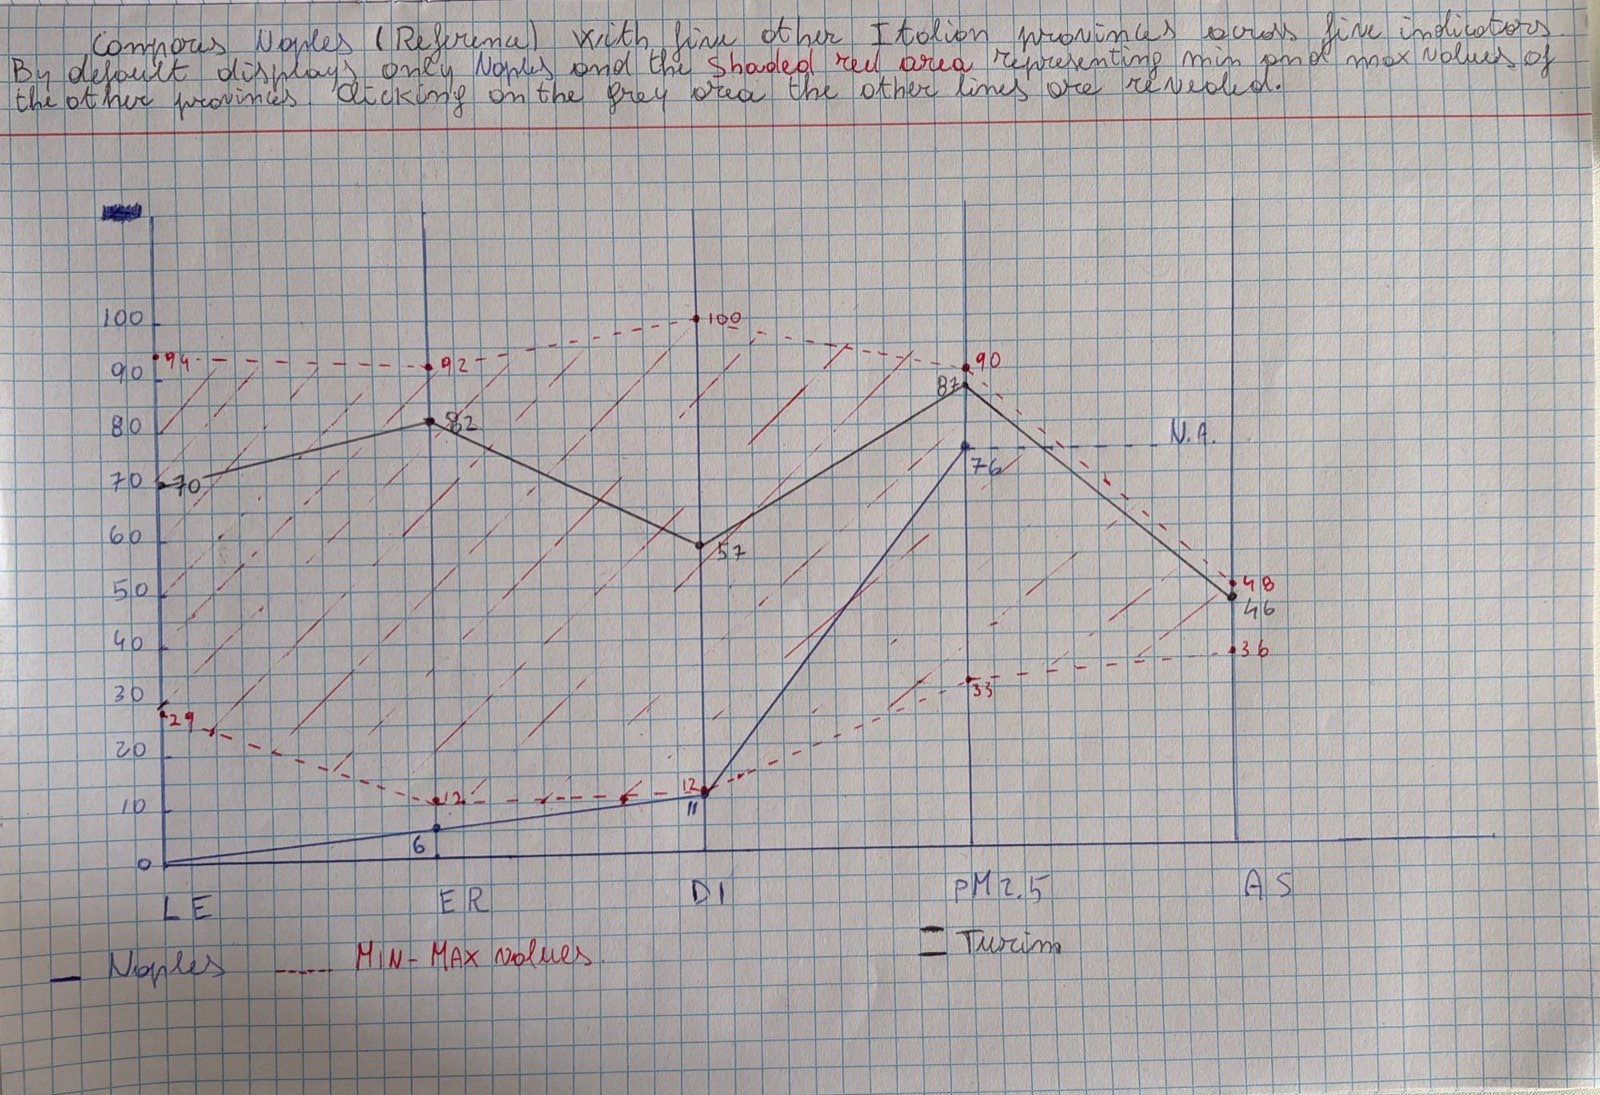
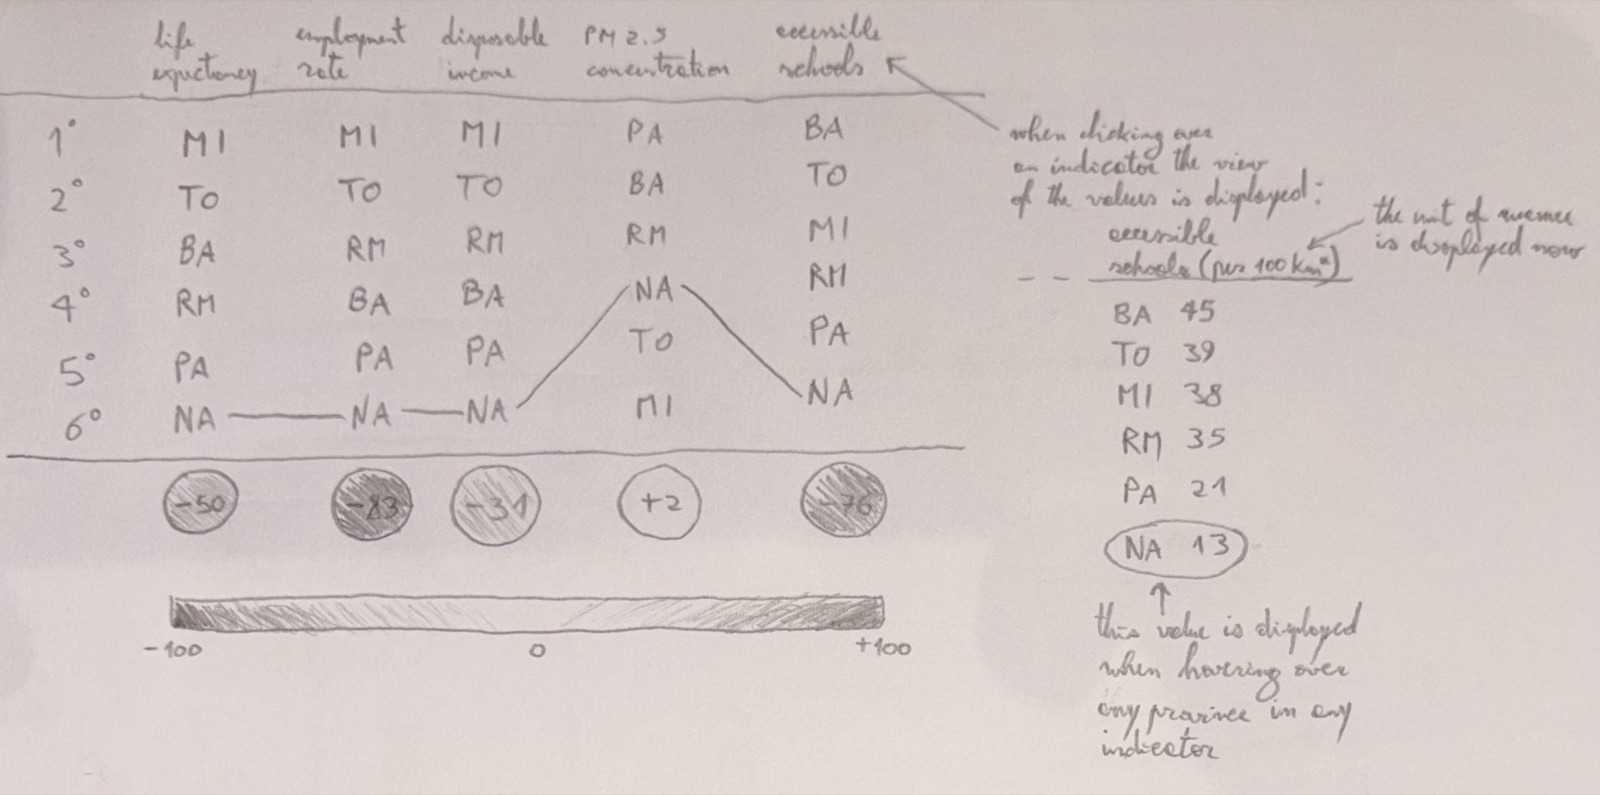
The band needs a 0–100 normalisation, so the real units disappear, and its shape depends on the arbitrary order of the axes. The rank chart shows who is ahead but not by how much. The dot chart keeps the original units and shows the size of every gap, so we picked it and fixed its weak points in the implementation.
Design
How to read it
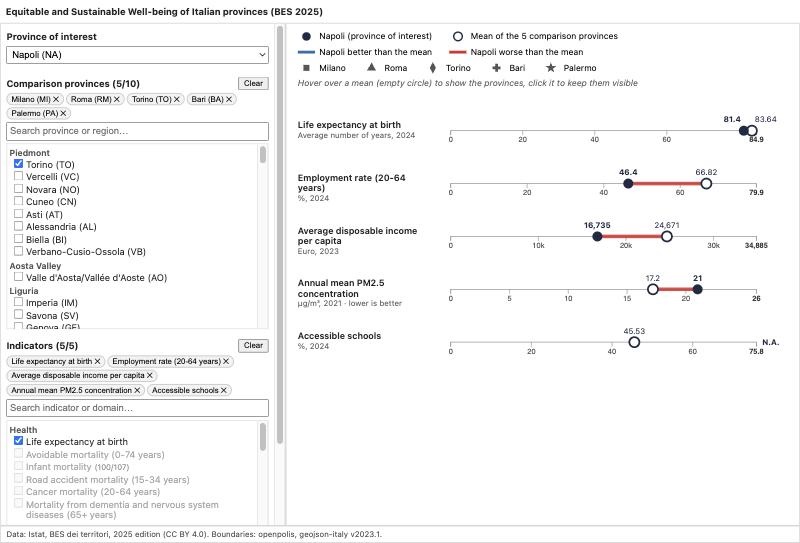
- Filled circleThe province of interest.
- Empty circleThe mean of the comparison provinces.
- Blue segmentThe province is better than the group.
- Red segmentThe province is worse than the group.
- SymbolsOne per comparison province, shown when a row is opened.
- Missing valueNo segment is drawn, nothing is guessed.
What changed from the sketch
- Colour means better or worse, not higher or lower. In the sketch, blue meant "higher than the mean". For PM2.5 that would paint more pollution blue. The polarity of each indicator now decides the colour, and those rows say "lower is better" under their name.
- Every axis spans all of Italy. Each axis goes from zero to the national maximum, written in bold. The scale of an indicator doesn't jump around when you change the selection, and you always see where the group sits in the country.
- The mean opens into the group. Hovering over the empty circle shows each province with its own symbol; clicking keeps the row open. Several rows can stay open, so two indicators can be compared province by province.
- Overlaps are stacked, not hidden. When two provinces have nearly the same value, one symbol moves a step down, so nobody disappears behind somebody else.
- Numbers where they help. The values of the province and the mean are written above the markers; tooltips add the unit, the year and the gap in percent.
Example
Naples against five big provinces
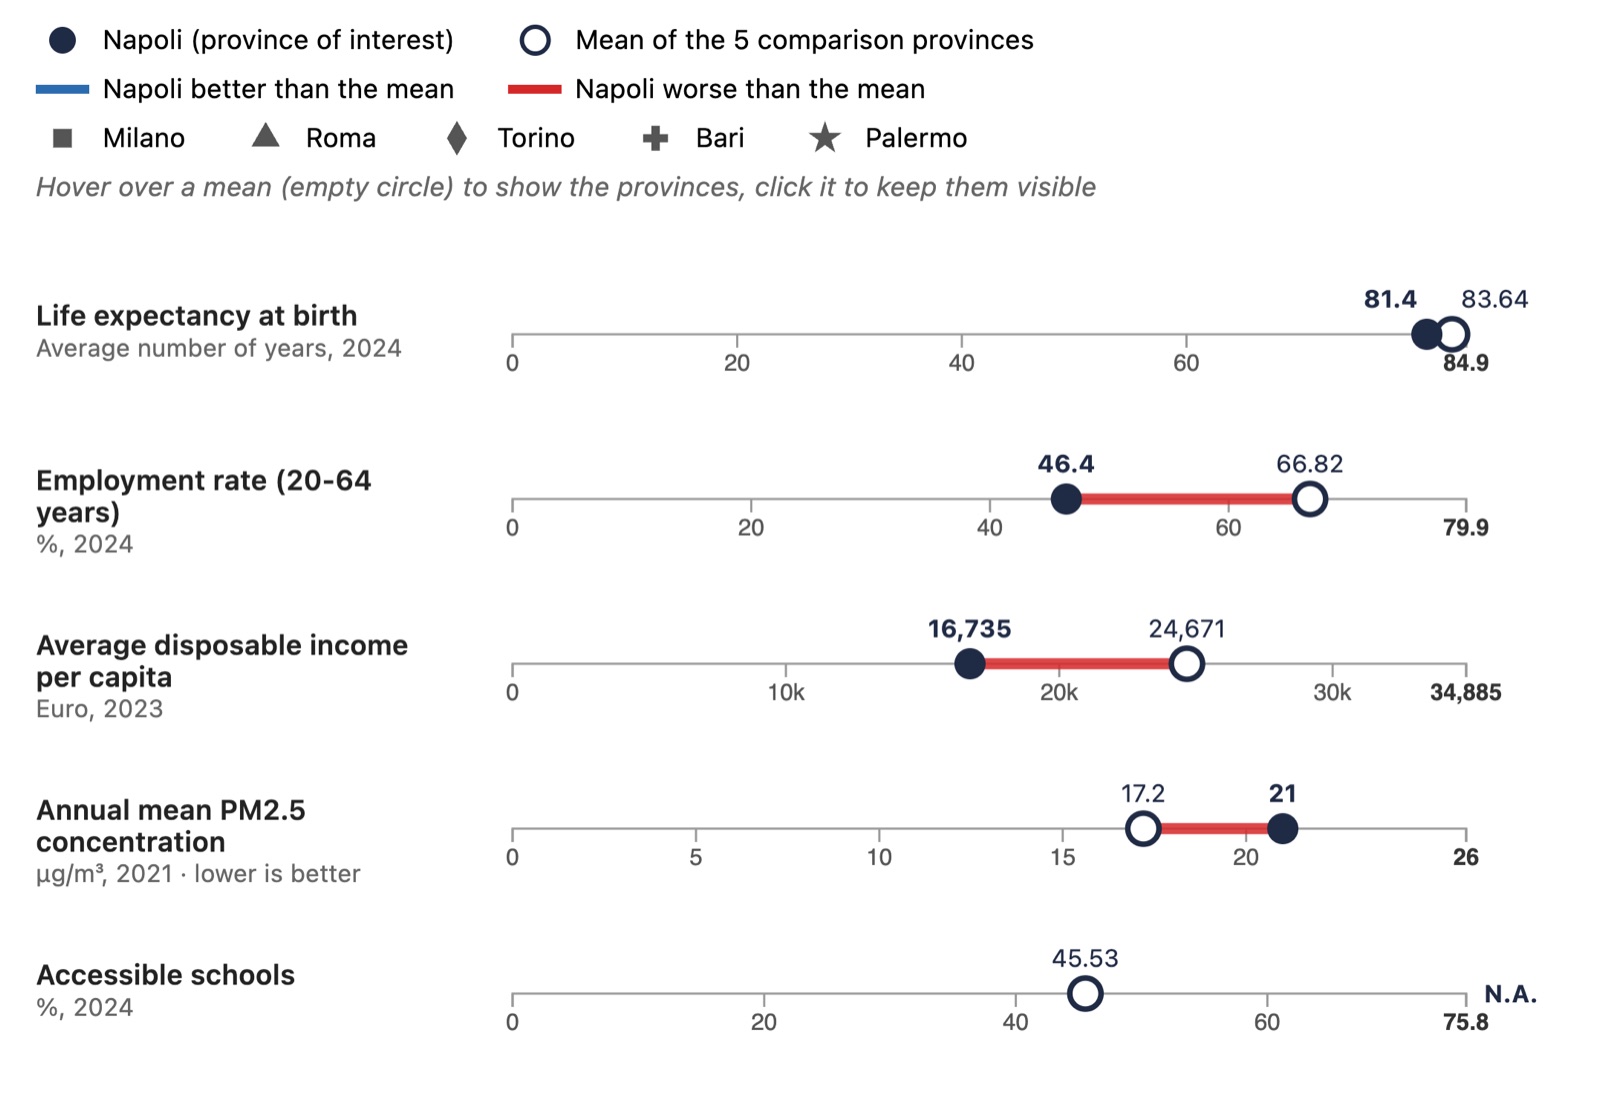
Naples compared with Milan, Rome, Turin, Bari and Palermo on life expectancy, employment, income, PM2.5 and accessible schools.
| Indicator | Naples | Group mean |
|---|---|---|
| Employment rate, 20–64 | 46.4% | 66.8% |
| Disposable income per capita | €16,735 | €24,671 |
| Life expectancy at birth | 81.4 years | 83.6 years |
| PM2.5, lower is better | 21 µg/m³ | 17.2 µg/m³ |
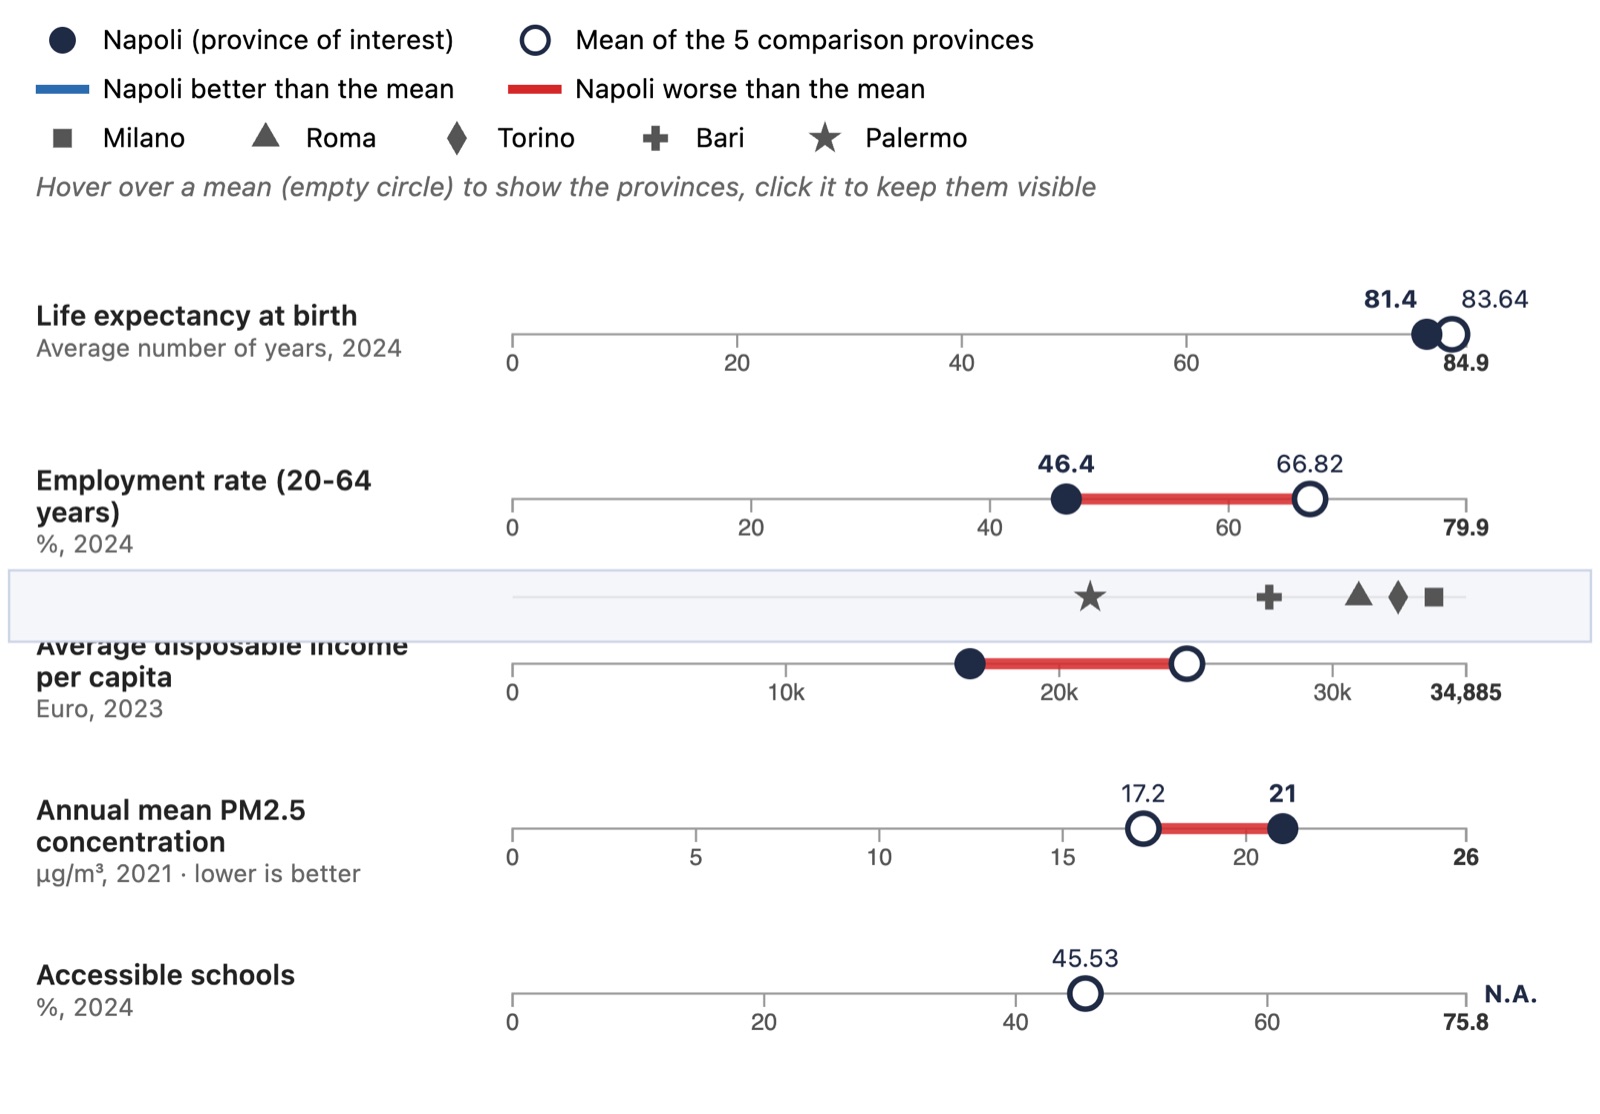
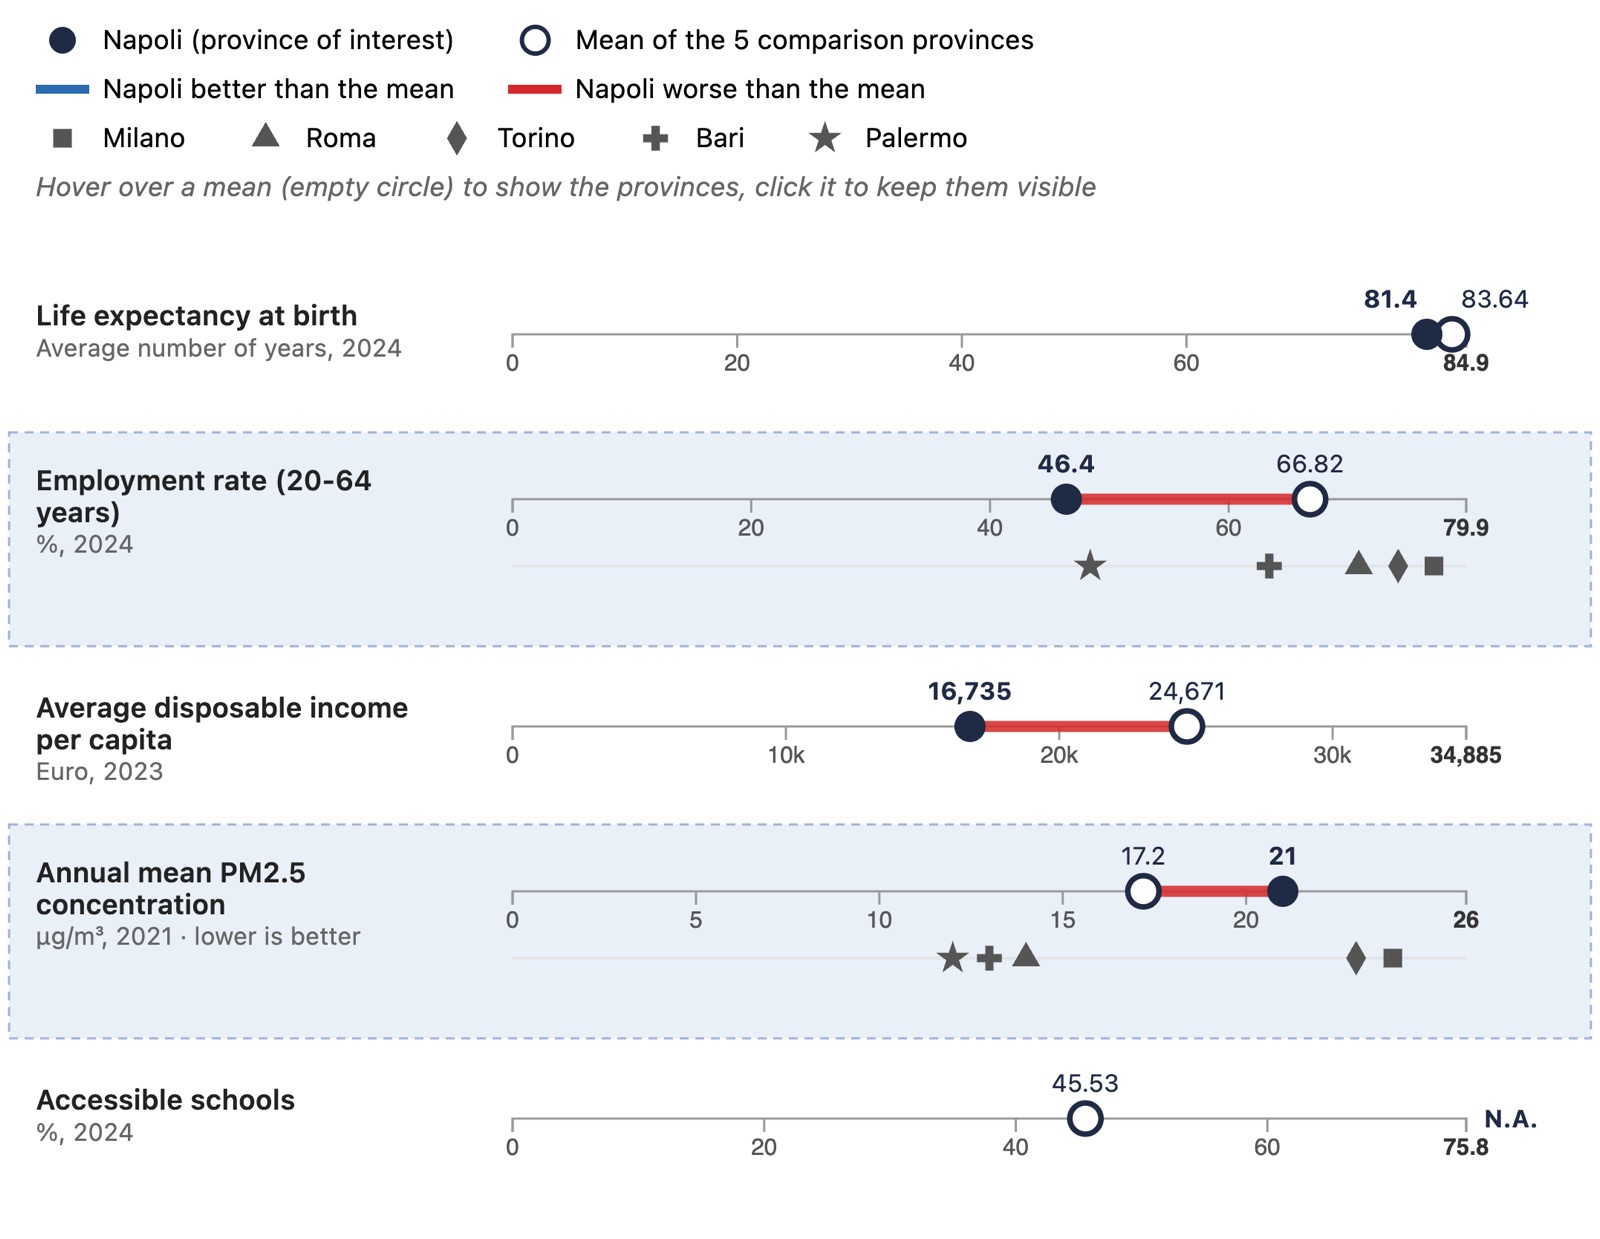
The answer. Naples is behind the group on life expectancy, employment and income, by far the most on employment and income. On air quality it sits in the middle. That second half is exactly what a chart showing only averages would have missed.
Build
How it's made
The chart is drawn directly with the D3 API (scales,
axes, d3.symbol), without chart
libraries or copied examples, in TypeScript on top
of the course's Webpack template. A small Python
script with only the standard library prepares the
data: the province table, plus a JSON file with each
indicator's English name, unit, year, polarity and
national quartiles.
The selection panel is grouped by region and by domain and searchable, with limits of 10 provinces and 5 indicators, so the chart stays readable.
- D3.js v7
- TypeScript
- Webpack
- Python
- ISTAT BES 2025
Sketches and design analysis were done by hand. As the course allows, we used an AI assistant (Claude) to help write the code, and reviewed and tested all of it.
What's next
A map and clusters
The project continues. The next step is a map of the 107 provinces, to see where the gaps are; the last one groups similar provinces with clustering and links that view to the other two. This page will grow with them.
Data: Istat, BES dei territori, 2025 edition (CC BY 4.0). Boundaries: openpolis, geojson-italy v2023.1.